Heat Curve Optimization: From Reactive Heating to Slow-Cooker Efficiency
My boiler stopped reacting to the weather and started anticipating it. Here's how weather compensation delivered 21% heating efficiency improvement—and the critical app issue you need to know about.
The Slow Cooker vs Oven Analogy
Reactive Heating (Oven)
- Wait until cold
- Blast with high temperatures
- Overshoot target
- Waste energy
- Constant thermostat battles
Proactive Heating (Slow Cooker)
- Anticipate cold weather
- Low and slow temperatures
- Maintain steady comfort
- Maximum efficiency
- Set it and forget it
Reactive Heating: Fast But Wasteful
Reactive heating is designed to heat your home as quickly as possible when you feel cold. Whether using a fixed flow temperature OR weather compensation with a high curve (like 1.5), the goal is speed—and that comes with drawbacks:
The Problems
- Overshoots target - blasts heat, goes too hot (uncomfortable)
- Dips below target - then gets cold again (uncomfortable)
- Constant cycling - on/off/on/off (inefficient)
- Wear and tear - cycling adds stress to components
- Wastes energy - high flow temps use more gas regardless of outdoor conditions
What It Does Well
- Heats home fast - high flow temps = quick warmth
- Responsive - "I'm cold NOW" gets results quickly
But you pay for that speed with higher running costs and uncomfortable temperature swings.
Weather Compensation with Low Curves: The Game Changer
Weather compensation automatically adjusts flow temperature based on outdoor temperature. Colder outside? Higher flow temp. Mild outside? Lower flow temp. But here's the key: you can still use weather compensation reactively (high curves like 1.5 for speed) OR proactively (low curves like 1.0-1.2 for efficiency).
The transformation happens when you combine weather compensation with a LOW curve. Now you're using variable temperatures optimized for efficiency, not speed.
The Taxi, Bus, Walk Analogy
Think of heat curves like different ways to get to work—all get you there, but at vastly different speeds and costs:
Curve 3.5 = Taxi
Fastest to warm up
Most expensive
Curve 1.2 = Bus
Medium warm-up speed
Medium cost
Curve 0.4 = Walk
Slowest to warm up
Cheapest
The key: Lower curves (like 0.4-1.2) take longer to heat your home, but if you're proactive and set heating to come on earlier, you reach target temperature exactly when you need it—for far less money than high curves (2.0-3.5).
Understanding Heat Curves
A heat curve defines the relationship between outdoor temperature and boiler flow temperature. As it gets colder outside, the water needs to be hotter—but not linearly. That's the "curve" part.
Heat Curve Temperature Data
My optimized setting of 1.13 sits between these curves. Notice how dramatically the flow temperature changes as outdoor temperature varies—this is weather compensation in action:
| Outdoor Temp | Curve 1.0 | Curve 1.2 | Curve 1.5 |
|---|---|---|---|
| -15°C | 61°C | 67°C | 76.5°C |
| -10°C | 56°C | 62°C | 69°C |
| -5°C | 52.5°C | 56°C | 64°C |
| 0°C | 46°C | 50°C | 56°C |
| 5°C | 41°C | 44°C | 48.5°C |
| 10°C | 36°C | 38°C | 41°C |
| 15°C | 28°C | 31°C | 33°C |
Key insight: All temperatures shown are for a desired indoor temperature of 20°C. Notice the dramatic range: at freezing (0°C outdoor), flow temperature varies from 46°C to 56°C depending on curve steepness. The curve automatically adjusts for changing weather—no manual intervention needed.
Safety Benefit: Even curve 1.2 at extreme cold (-15°C outdoor) produces only 67°C flow temperature—significantly safer than traditional 75°C+ systems that cause burns.
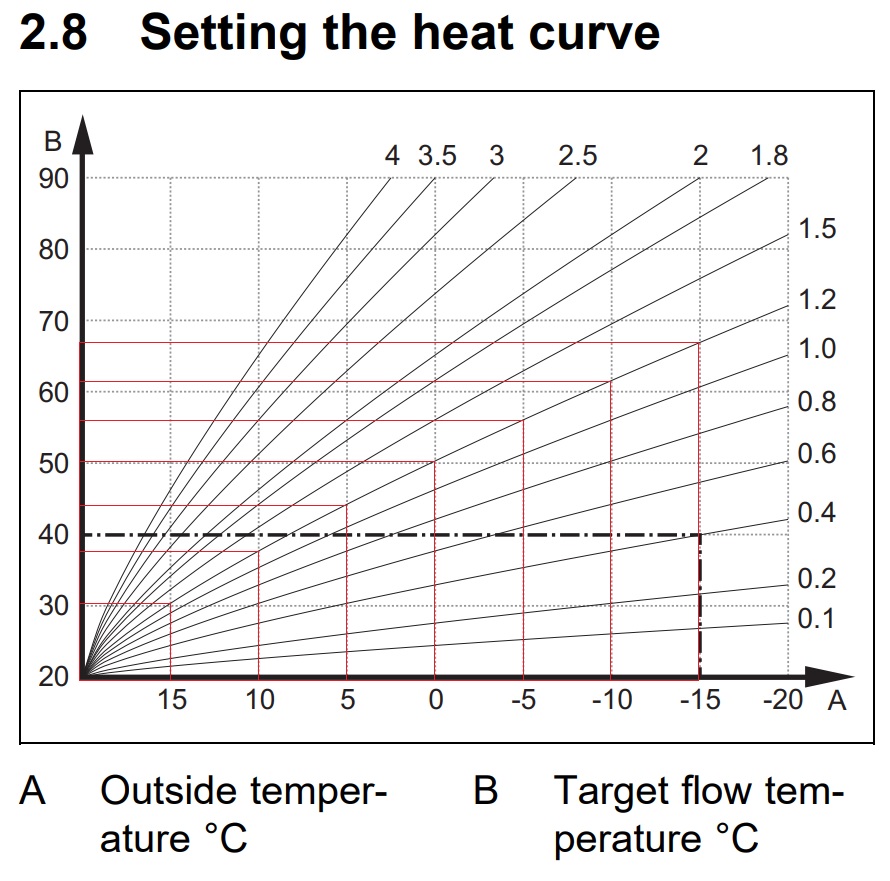
Visual representation of heat curve 1.2 from the Vaillant VRT 380f/2 manual
For a more in-depth analysis of this chart, see Michael de Podesta's article on Protons For Breakfast
The Full Spectrum: 0.1 to 4.0
Heat curves range from 0.1 (ultra-low for underfloor heating) to 4.0 (for undersized radiator systems). Understanding where your setting sits reveals how much optimization potential exists:
Note: The Vaillant chart displays flow temperatures up to 90°C. Curves 2.5+ produce temperatures beyond this display limit at cold outdoor conditions—the actual flow temperatures continue higher, they just can't be read from the diagram.
Curve 0.1 - 0.6: Underfloor Heating Territory
Example: Curve 0.4
- • -15°C outdoor → 40°C flow
- • 0°C outdoor → 33°C flow
- • 15°C outdoor → 24°C flow
Typical use: Well-insulated homes with underfloor heating. Vaillant recommends 0.4 for this scenario.
Won't work with radiators - insufficient heat output
Curve 0.8 - 1.2: Aggressive Optimization Zone (← You are here at 1.13)
Example: Curve 1.0
- • -15°C outdoor → 61°C flow
- • 0°C outdoor → 46°C flow
- • 15°C outdoor → 28°C flow
Typical use: Well-insulated homes with oversized radiators. Vaillant recommends ~1.1 for this scenario.
Your 1.13: Impressively low for radiator heating - requires proactive scheduling
Curve 1.5 - 2.0: Installer "Safe Zone"
Example: Curve 1.8
- • -15°C outdoor → 85°C flow
- • 0°C outdoor → 62°C flow
- • 15°C outdoor → 35°C flow
Why installers use this: Guaranteed warm house, no callbacks about "not hot enough". Vaillant recommends ~1.5 for older houses.
Trade-off: Higher running costs, less efficiency optimization
Curve 2.5 - 4.0: Undersized Radiators
Example: Curve 3.0
- • -3°C outdoor → 90°C+ flow
- • 0°C outdoor → 82°C flow
- • 15°C outdoor → 41°C flow
Why these exist: High curves compensate for undersized radiators that need very hot water to deliver enough heat. At -3°C, curve 3.0 requires 90°C+ flow (beyond the chart's display limit).
Less efficient and loses the full benefit of weather compensation's optimization potential
The Optimization Gap: Most installers use curves 1.5-2.0 to avoid callbacks. Your 1.13 is in the aggressive optimization zone (0.8-1.2) that most homeowners never explore—this is where the real efficiency gains hide.
Key Settings
- Steepness: How aggressively flow temp increases
- Minimum flow: Lowest boiler will go
- Outdoor switch-off: When heating stops
My Settings
- Heat curve: 1.13 (intended)*
- Minimum flow: 15°C
- Outdoor switch-off: 21°C
- *Context: Oversized radiators, well-insulated 1970s house. These are aggressive settings.
The Critical App Problem
THE ISSUE: myVAILLANT App Keeps Changing My Heat Curve
After months of careful optimization to reach 1.13, I watched the app automatically change it without my permission:
- Started at optimized 1.13
- App changed to 1.21 (observed during earlier screenshot)
- App changed to 1.36 (observed in app-10.jpg)
- App changed to 1.39 (most recently observed)
This isn't user error—the app is doing this automatically. It completely undermines manual optimization efforts.
SOLVED: The Adaptive Heat Curve Setting
After contacting Vaillant, I discovered the culprit: Adaptive heat curve was automatically adjusting my settings.
The Fix (VRC 720 thermostat):
- Press MENU on thermostat
- Go to SETTINGS
- Enter Installer Level (code: 00)
- Navigate to Installation Configuration
- Select INSTALLATION
- Find h4. Adaptive heat curve
- Set to Deactivated
Since deactivating this feature, my 1.13 setting has remained stable.
Important Takeaways
- Check your settings regularly if you're optimizing heat curves
- The app's manual selection only offers 1.09 or 1.14—can't select 1.13 directly
- This might be why many people give up on weather compensation optimization
The 3am Thermostat Bug Discovery
The night after boiler installation (January 17-18, 2024), something was very wrong. The boiler wouldn't turn off. It kept heating the house to 20°C regardless of my schedule settings.
At 2am, frustrated and unable to sleep, I made a decision: read the entire VRT 380/f manual from beginning to end.
The Problem
- Boiler heating constantly to 20°C
- Completely ignoring schedule settings
- Wouldn't turn off until house reached 21°C
- Not good for trying to sleep
The Discovery (02:52)
- Found answer on page 14 of manual
- Setting: "OT constant heating: °C"
- Value wasn't configured properly
- Fixed it at 3am
What Was Wrong: The "OT Constant Heating" Bug
The Setting: Menu → Settings → Installer level → Installation configuration → Weather compensation → "OT constant heating: °C"
What it does: Controls heating when outdoor sensor detects temperature below set threshold. If outdoor temp falls below this value, it uses the heat curve to regulate room temperature to 20°C outside of programmed time periods.
The Problem: Without a temperature value set, it defaulted to heating the house to 20°C constantly at ALL times, ignoring normal schedules. Only stopped when house reached 21°C.
The Fix: Set the value correctly (e.g., 5°C for background heating on very cold nights) or turn it Off (factory default).
This issue was specific to having an outdoor sensor connected. Without the sensor, this setting wouldn't apply.
The Bigger Picture
Installer context: The father-and-son team was honest from the start—advanced controls were more the son's area. Not many customers choose weather compensation, so limited hands-on experience.
Parallel troubleshooting: The installer was actively trying to help, contacting Vaillant's rep. I just solved it first.
Documentation saved the day: Keeping the manual accessible enabled 3am problem-solving when needed.
Reality check: These systems ARE complex, especially outdoor sensor integration. This wasn't installer incompetence—it's just how advanced modern heating controls can be.
Why Installers Don't Optimize
The uncomfortable truth: installers optimize for callbacks, not efficiency.
High Heat Curve
- Guaranteed warm house
- No "not hot enough" complaints
- No callbacks = save time and money
- Higher running costs for customer
Low Heat Curve
- Maximum efficiency
- Lower running costs
- Risk of "not warm enough" calls
- Requires weeks of testing and adjustment
They're not wrong to do this—it's business reality. But YOU can optimize if you're willing to iterate. The reward? I achieved 21% heating efficiency improvement (weather-normalized data).
Practical Optimization Guide
What You Need
Equipment
- Condensing boiler with weather compensation
- Outdoor temperature sensor (Glow-worm £65-75 vs Vaillant VR20 £130-170)
- Access to heat curve settings (Vaillant now via app—previously installer code only; others may still need installer access)
Prerequisites
- Oversized radiators (essential for low flow temps)
- Good insulation (weather compensation can't fix poor insulation)
- Patience for weeks of testing
The Optimization Process
Start with manufacturer's recommended setting
Use the setting for your home type as baseline
Wait 3-4 days to observe
See how your house responds to current settings
Adjust in small increments
If too cold: increase by 0.05-0.10. If too hot: decrease by same amount
Document outdoor temps and comfort
Track patterns across different weather conditions
Iterate across weeks
Takes weeks across different weather to dial in properly
The Results
Heating Efficiency Improvement
(Weather-normalized data)
Annual Savings
(Boiler upgrade including optimization)
Average Flow Temperature
(vs 60-70°C conventional)
Practical Benefits
- House stays comfortable without thermostat adjustments
- No more "it's cold, crank it up" battles
- Maximum condensing efficiency maintained
- Flow temperatures in high 20s to low 30s°C
- Part of £530/year total savings vs Year 1 baseline (all improvements combined)
Limitations and Trade-offs
This Isn't For Everyone
Requires patience - Not instant gratification, takes weeks to optimize
Won't work with undersized radiators - Need large surface area for low flow temps
Can't fix poor insulation - Weather compensation optimizes delivery, not retention
Kitchen got colder - Boiler more efficient = less waste heat (proof of efficiency!)
Advanced optimization - Not beginner-friendly, needs technical interest
The Bottom Line
Weather compensation changed how I think about heating—from reactive (respond to cold) to proactive (anticipate cold). You can choose the taxi (curve 3.5—fast, expensive), bus (curve 1.2—medium), or walk (curve 0.4—slow, cheap)—all get you there, but planning ahead with a lower curve saves substantial money.
This requires the right system: condensing boiler + oversized radiators + good insulation. Not for everyone—needs technical interest and patience to optimize over weeks of testing.
But if you're willing to iterate and be proactive with your heating schedule: 21% heating efficiency improvement and £154/year savings are worth it.
This is why installers stick to high curves (1.5-2.0)—less hassle, fewer callbacks. But for those willing to optimize down to the 0.8-1.2 range: significant gains are possible.
Related Articles
Complete Home Heating Upgrade Journey
From blocking letterboxes to heat curve optimization - the full story of our heating transformation.
Vaillant Ecotech Plus 826: 2 Years Real-World Performance
21% efficiency improvement and £154/year savings with the boiler that made this optimization possible.
Warm Not Hot Radiators: Why Lower Flow Temperatures Are Better
Child safety statistics and the efficiency benefits of 31-67°C flow temps vs traditional 75°C+.
Living Through a Winter Heating Replacement
5 days without central heating, temporary heaters, and keeping a toddler warm in December.
Personal Note: myVAILLANT App Issue (Specific to My Setup)
I've experienced an issue where the myVAILLANT app automatically changes my heat curve setting without user intervention (1.13 → 1.21 → 1.36 → 1.39). This is specific to my setup and I'm awaiting a response from Vaillant.
Context: Heat curve settings were previously installer-only (accessible through indoor thermometer with installer code). Now that Vaillant added this to the app for homeowner access, this auto-changing behavior emerged in my system.

App screenshot showing heat curve steepness setting